Visualizing WhatsApp Chat History
It’s been quite some time since i wrote these scripts to visualize and analyze WhatsApp chat histories. Now, considering the fact that i’m relatively free, looking for jobs and stuff, i finally decided to write a new blog post (sure, nobody cares, but..but.. if someone likes this they could use this and further expand on it. YOLO and all that.). Clarifying first and for all, my laptop backups and memory cards are full of WhatsApp histories, but they are all encrypted .bak files and considering that i was a “Blackberry Boy” (the BIS internet plan), that made it impossible to send the .txt files to myself for analysis. Bummer. Bummer. Bummer.
Anyways, i just started asking my friends to send me the chat history between us. Now, it was necessary to get chat histories from dudes who i’ve been talking to since the past 2-3 years (needed temporal data; the more data points the better). So, the problem with asking other people for WhatsApp chat history is that the text output is not standardized. Android guys have a different format, Apple punks their own, et cetera. Hence, i could not work with a single Python script for all distinct types of data input. I’ll just explain one of the scripts i used, the one for the Apple chat history.
Word of Advice: It is better to install the SublimeText text editor. Seriously. It is amazing, with its regex and library tools and also the multi-line cursor possibilities. Sure, Python regex can parse almost everything easily, but you still have to think about all the possible breaking points like line breaks and indentation. One can’t think about all the errors that might creep up in the input data. So it is much better to just open the .txt data inputs in SublimeText, glance at it and manually handle all the data errors that are there. Just saying. BASH/Python/Perl script ninjas can just ignore the advice and run their regexes.
Problem Statement
The idea is to visualize temporal data, ie. some data value plotted over a period of time. So, the data is collected by saving the WhatsApp chat logs taken over a period of 1 month to 2 years. It has all the dates taken and then plotted as message count between the user ie. “Me” and “Friends”.
The Data
The data is in the form of messages between people attached with the appropriate time and date stamps, spread across different communication days.
05/12/12 10:50:12 AM: AV: Bhai, delhi has pollution.
05/12/12 5:35:49 PM: ABC: Pollution ko maar goli. Thandi hai
05/12/12 5:41:12 PM: AV: Lol... Vo to hain hee... Raat ko jaada.
05/12/12 5:41:50 PM: AV: my parents they bought me the new one I wanted, Masst blackberry hain.
Here AV = Ankit Vadehra (ie. me) and ABC = a friend. We require the dates, ie. 15/03/13. Hence we distribute the dates in two files, one for each user. Then we can calculate the number of messages sent by each person and visualize them in temporal form. We also take the messages sent and construct word clouds so that we can see the most frequently used words. That’s about it. The gist of what i’m trying to do. No hi-fi nonsense. YOLO again!!
Mumbo-Jumbo, Coding..
The idea is to divide the project in two halves. Separate the chat history into dates and messages (since i’m distributing the data by distinct dates, i’m ignoring the timestamp attached with each message; consider only the date). The dates will help in visualizing the frequency of messages over a period of time and the messages are fed into an online word-cloud generator to see the most frequent words used. (The word cloud can also be generated using Python, but the online generators like Wordle etc. are much prettier. Ha Ha Ha Ha ;) )
me  = "Ankit Vadehra:"
you = "ABC:"

ankit_date = open("ankit_date.txt","w")
ABC_date   = open("ABC_date.txt","w")

x = open("ABC.txt","r")
y = x.readline().decode('utf-8-sig').encode('utf-8')
while y:
  if (me in y):
    temp = y.split(" ",1)
    ankit_date.write(temp[0]+"\n")
  elif (you in y):
    temp = y.split(" ",1)
    ABC_date.write(temp[0]+"\n")
  y = x.readline().decode('utf-8-sig').encode('utf-8')
Now, the explaining part. Here, ABC = my friend’s name obscured for privacy and all that stuff, you know. The variables me and you are user specific. They need to contain the name in the chat history, however you get it in the .txt file. Now we gotta parse the chat history line by line and separate the dates into different .txt files that will be used later for counting the number of messages per day and for visualization. Let me quickly explain the Python split function here.
Let’s say that the variable y contains each line in the chat file per iteration, so y = 13/10/13 10:20:28 pm: ABC: Python is nice. Now, temp = y.split(" ",1) creates an array temp. It splits the line in two parts, separated by the first blank space. Hence, we get:
temp[0] = 13/10/13
temp[1] = 10:20:28 pm: ABC: Python is nice
The if condition just checks whether the name in the line is me-or-you, and then writes the date, ie. temp[0], to separate .txt files for the two users. After running this we get two outputs, ankit_date.txt and ABC_date.txt, which look somewhat like this:
02/10/13
13/10/13
13/10/13
13/10/13
13/10/13
...
These are all the dates on which i sent messages. The number of times a date occurs = number of messages sent on that date.
Now, the second part is separating the messages and cleaning them, removing all emoticons and unnecessary punctuation, so that all that remains is the proper words in the message.
import re
b = open("ABC.txt","r")
a = open("messages.txt","w")
y = b.readline().decode('utf-8-sig').encode('utf-8')
while y:
  if(y != '\r\n'):
    temp = y.split(": ",2)
    x = temp[2]
    x = re.sub('([\:\;][\)\|\\\/dDOoPp\(\'\"][\(\)DOo]?)','',x)
    x = re.sub('[?\.#_]','',x)
    x = re.sub('[\s]+',' ',x)
    a.write(x+"\n")
  y = b.readline()
Here temp = y.split(": ",2) breaks the line into a timestamp-and-name part and a message part, and the three regex substitutions strip emoticons and stray punctuation. The output is a clean list of messages:
Can Python be used to design and implement Frontend design of websites, or only backend/server support
I know PHP does both, backend+frontend
Web2py and django frontend design kar sakte hain kya
I guess Django is a framework and lets u do that
PS: This message is way old, like mid-2012. I was a newbie and didn’t know jack about web-application development, so, Yeah..
Now we have to count the number of times a date has occurred. For that we use Python’s Counter.
x = open("dates.txt",'r')
y = x.read()
from collections import Counter
print Counter(y.split('\n'))
29/04/2015 120
23/04/2015 34
15/04/2015 25
29/03/2015 15
27/04/2015 12
25/04/2015 11
22/04/2015 6
30/04/2015 3
30/03/2015 1To convert simple stuff like 15 → 2015, we use the find-and-replace feature of SublimeText, because it’s just so awesome.
Visualizing the Temporal Data
We use Matplotlib for a simple temporal plot of the message count against the dates.
import numpy as np
import matplotlib.pyplot as plt
import matplotlib.dates as mdates

days, messages = np.loadtxt("ankit_count.csv", unpack=True,
        converters={ 0: mdates.strpdate2num('%d/%m/%Y')})
days2, messages2 = np.loadtxt("ABC_count.csv", unpack=True,
        converters={ 0: mdates.strpdate2num('%d/%m/%Y')})
plt.xlabel('Date')
plt.ylabel('Message Count')
plt.plot_date(x=days, y=messages,color='m',label='Me',linestyle=':')
plt.plot_date(x=days2, y=messages2,color='c',label='Friend',linestyle='-.')
plt.legend()
plt.show()
This is pretty much self-sufficient and we end up with the following outputs:
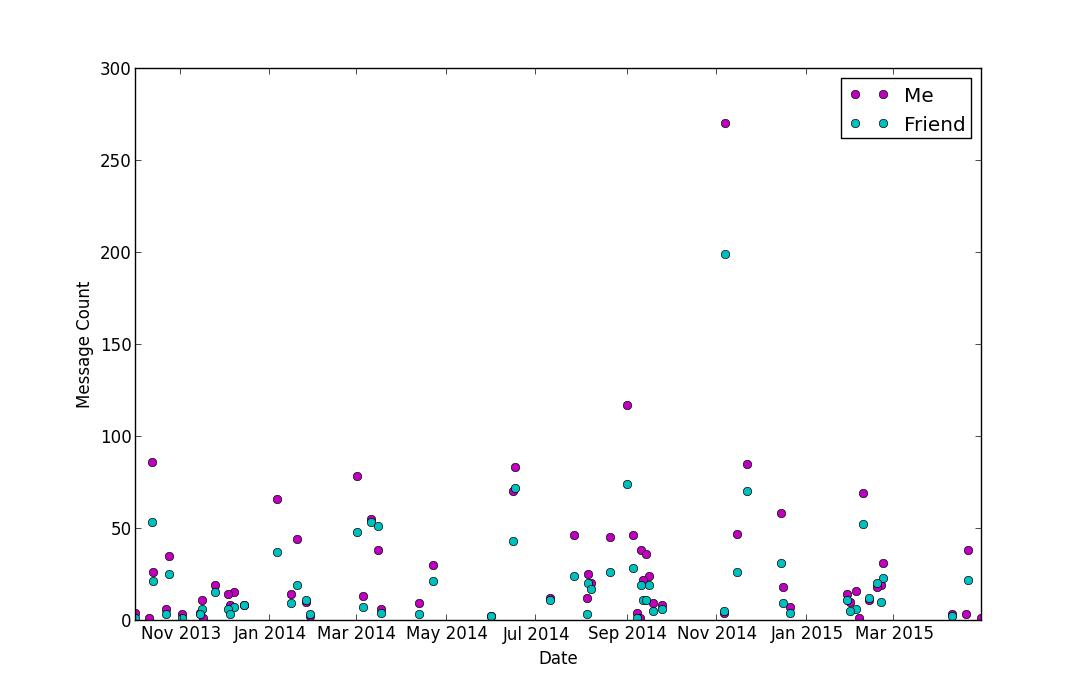
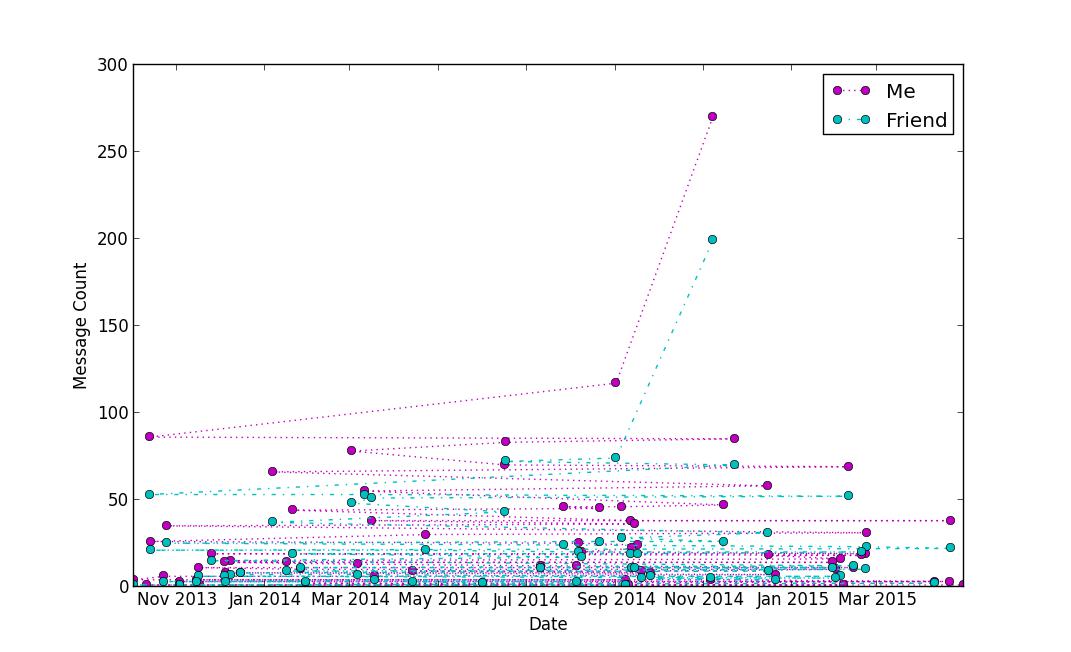
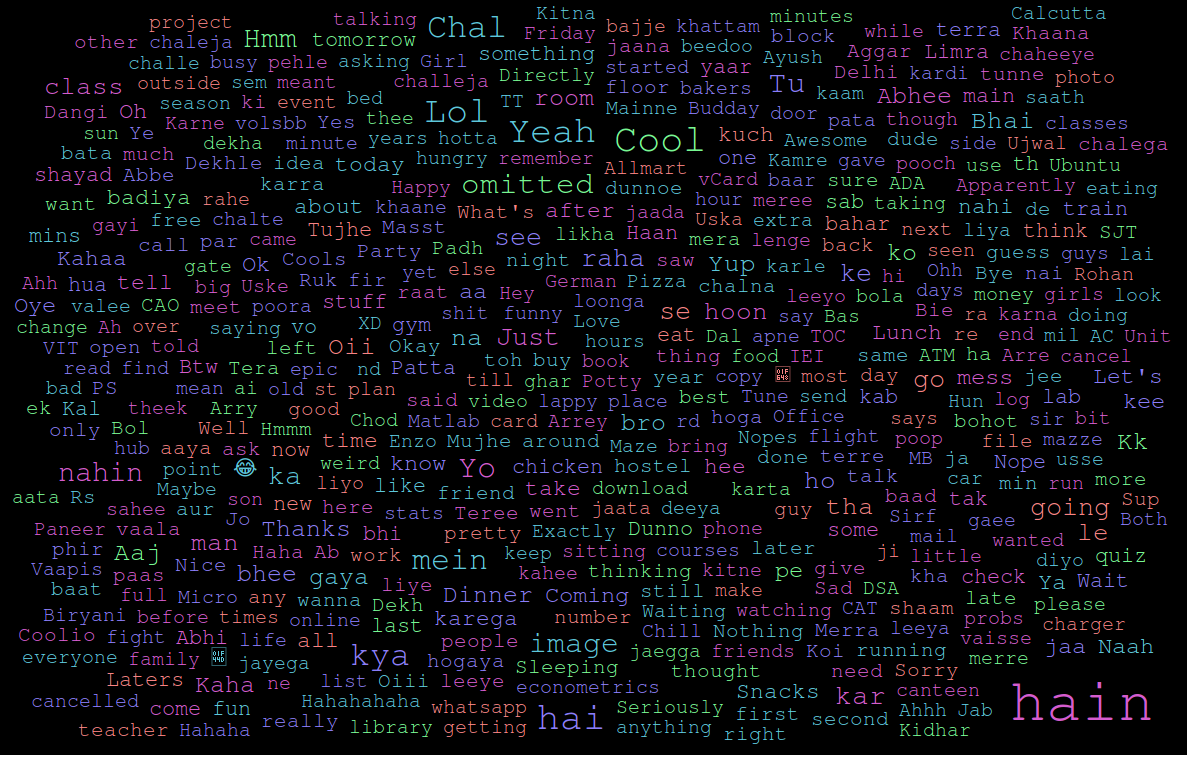
This is what i did, and that’s about it. Find the accompanying code on my GitHub: Visualize WhatsApp Chat History.
Next step, visualizing my Google history and clustering it on the basis of title similarity.. Laters..
–Ankit Vadehra